

Temperature and humidity data collected using an Arduino while in three cities in Alaska, moving from interior spaces to exterior spaces. The graph shows the drastic change in climate over a four minute interval.


Temperature and humidity data collected in Anchorage, Minto and Utqiagvik that I later mapped in GIS to spatially represent the information.

I constructed the Arduino specifically to collect temperature, humidity and GPS location at a two second interval. We wanted the data to show transitions between indoor and outdoor environments in Arctic spaces, as part of a study of thermodynamics in the built environment.


Notes and sketches done during our 10 day trip through Alaska. We met with many specialists related to Native Alaskan culture and history, climate science, building technology, landscape architecture and design, and many more.

CONVECTION / fluid transference of heat
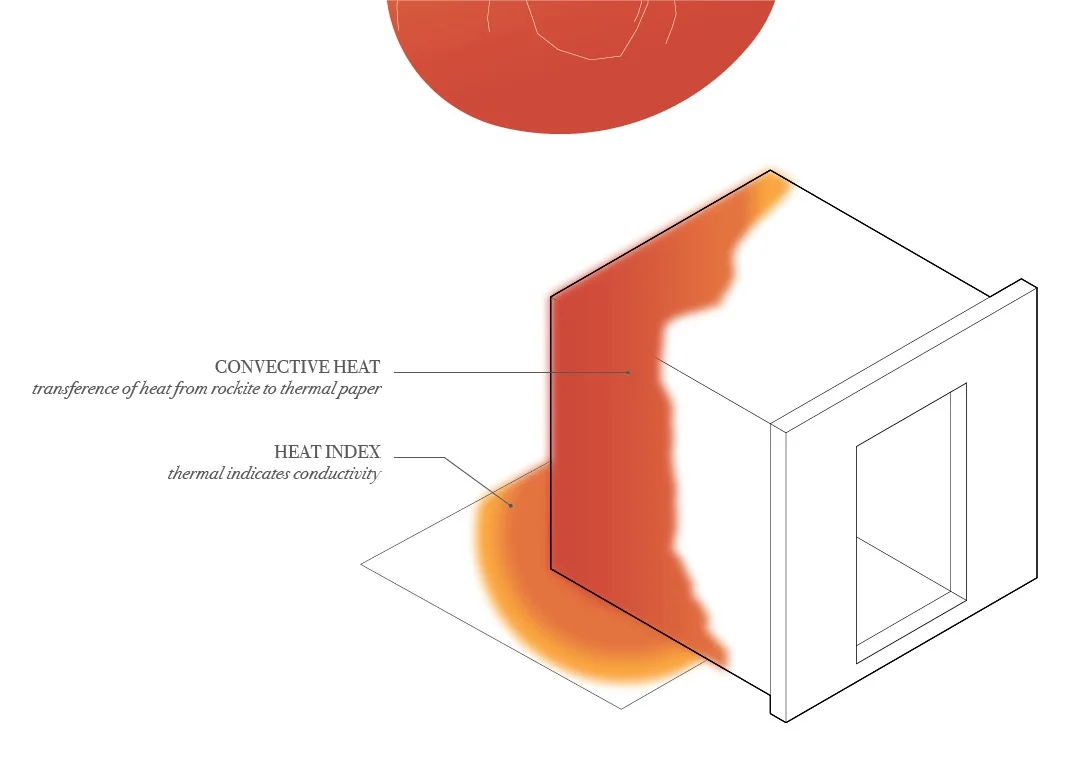


RADIATION / heat transference through electro-magnetic waves


CONDUCTION / heat transference through and object

